After dipping to year-to-date lows earlier in December, some cryptocurrencies are showing first signs of recovery.
Cryptocurrencies as an asset class are maturing and carving out their own niche. While the equity markets had their worst week in the past 10 years, the crypto markets have bounced sharply from their lows, showing first signs of a recovery.
However, after the massive destruction of wealth this whole year, it will take more than a bounce to confirm the start of a new uptrend. Though these bounces are a good opportunity for short-term traders, the investors need to look for large bottoming formations which signal the beginning of an uptrend.
After the initial bounce, the traders will look for signs of improving fundamentals before coming in with new money. Therefore, although the bounce is a positive sign, it is still not an all-clear signal. Let’s look at the top five performers of this week.
BCH/USD
Bitcoin Cash saw massive buying over the week. It turned out to be the best performing cryptocurrency by a huge margin. The surge helped it climb back to the fourth spot in terms of market capitalization.
However, before the rally began, Bitcoin Cash’s price was overtaken by Ethereum for the first time ever, which shows the kind of damage the bear market and the hard fork had on it. So, after the recent upswing, what is in store for us in the near future? Let’s find out.

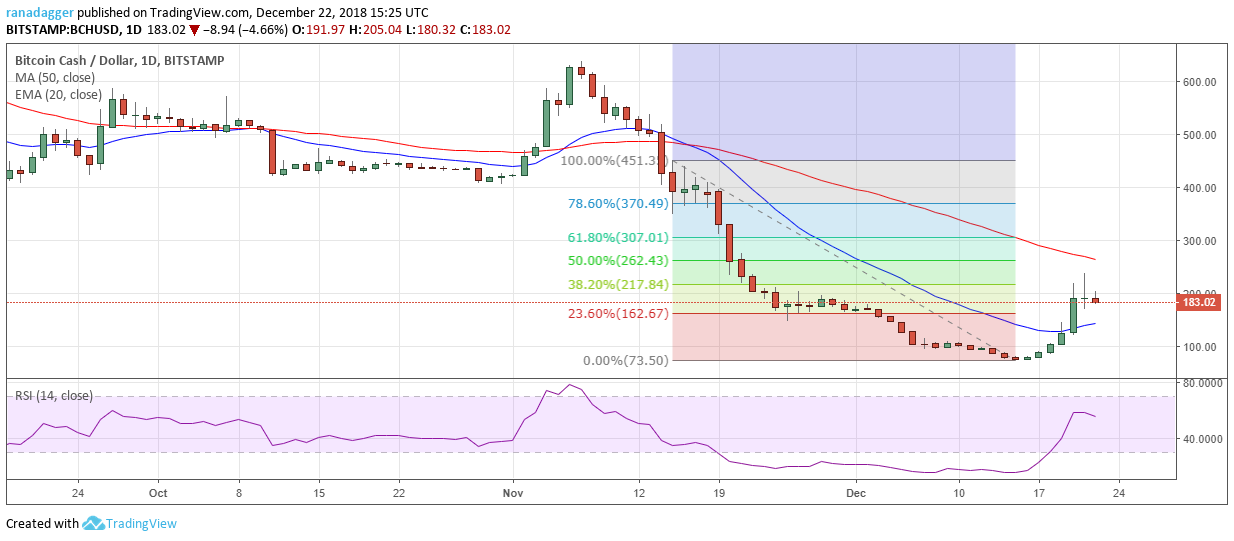
We shall consider only the period after the most recent hard fork. From the intraday high of $451.35 on Nov. 15, the BCH/USD pair plunged to an intraday low of $73.5 on Dec. 15. That’s a fall of 83.71 percent in a month. As the crypto markets are hugely volatile, we always advocate trading with the use of stop losses.
The major trend still remains down, but the short-term trend looks to be changing. The 20-day EMA is turning up, and the RSI is also in the positive territory, which validates our outlook.
Nonetheless, even after the recent pullback, the cryptocurrency has only retraced close to 50 percent of the latest fall. We anticipate a strong resistance at $262.43, as the 50-day SMA is also located at this level.
If BCH doesn’t give up much ground in the next couple of days, it would suggest strong buying support at these levels. If the bulls sustain the price above the 20-day EMA, it will increase the probability of a rally to $307.01, which is a 61.8 percent Fibonacci retracement of the fall.
However, if the bears again pounce and sink the price below the 20-day EMA, it can slump back to the lows.
IOTA/USD
The teams of the IOTA foundation and Audi have presented the results of their five-month long project to a select audience. The focus was to find solutions for real world problems in the area of mobility, internet of things and the automotive industry.
The IOTA foundation announced a new hash function named “Troika,” developed by CYBERCRYPT. Though it has completed various rounds of review, the foundation has opened it to the public for evaluation. The team or individual that cracks it can walk away with prize money of €200,000.

The IOTA/USD pair has given up a lot of ground from its all-time-high of $5.8 recorded in December of last year. From its peak, the price fell to $0.2051 on Dec. 7, where buying emerged.
Though the price has rebounded about 77 percent from the lows, at the current price it is still down roughly 94 percent from the highs. This confirms that the main trend is down, but there are signs of a change in the short-term trend.
The 20-day EMA has started to turn up, and the RSI is in the positive territory, which suggests that the bulls have the upper hand in the near term. Currently, the recovery is facing resistance at the 50-day SMA, which is sloping down.
If the bulls break out of this, a move to $0.4037, followed by a rally to $0.5095 is probable. On the other hand, if the price turns down from the current levels, it might find support at the 20-day EMA. A break of this support can sink the virtual currency to $0.25 and below that to $0.2051.
Traders who are holding long positions from the lower levels can book partial profits and trail their stops higher on the remaining position. Others, who are waiting to buy, can wait for a higher low to form before jumping in to buy.
TRX/USD
The number of TRON mainnet accounts has surpassed 900,000, a significant milestone. Its network continued to grow even in the bear market and it has now processed more than 100 million transactions. Will the growing numbers result in a higher price? Let’s find out by studying the pair’s weekly chart.

The TRX/USD pair has broken out of the overhead resistance and has again re-entered the range of $0.01587681–$0.02990592. The price had remained inside this range since mid-August before breaking down four weeks back.
However, the bears could not capitalize on the breakdown and push the price lower. Aggressive buying at lower levels has pushed the price back into the range. This confirms that the markets have rejected the lower levels.
The digital currency can now rally to the next overhead resistance at $0.02990592. We expect this level to act as a major roadblock for the bulls. However, once that line is crossed, the cryptocurrency should start a new uptrend.
On the downside, if the price stays above $0.01587681, it can be a buying opportunity. The downtrend will resume if the bears sink the pair below $0.01089965.
BSV/USD
At one point, Bitcoin SV and Bitcoin Cash were trading just $10 apart. However, the subsequent recovery of both cryptocurrencies saw Bitcoin Cash surge ahead. Will Bitcoin SV play catch up, or have their performances diverged? Let’s find out.

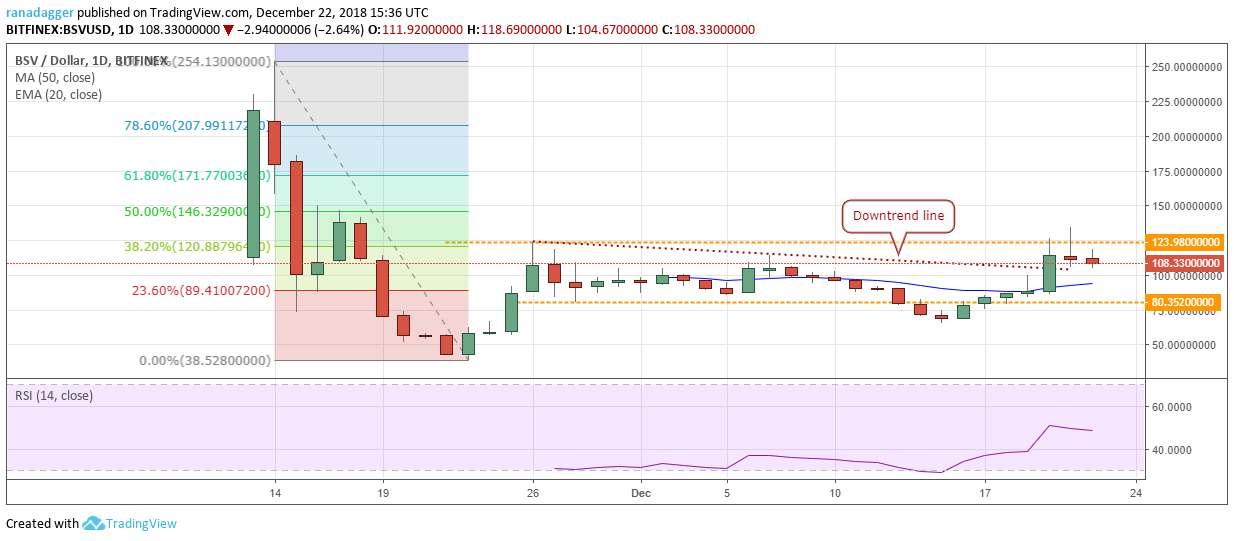
The BSV/USD pair has been trading inside the range of $80.352–$123.98 since Nov. 26. The breakdown of the range on Dec. 13 proved to be a short-term affair, as the price quickly climbed back into it by Dec. 17. This shows that the markets have rejected the lower levels.
The subsequent rally has carried the price back to the top of the range. Efforts to break out of the range failed to sustain on Dec. 20 and Dec. 21. However, a positive sign is that the virtual currency has not given up much ground — that shows buying support.
If the price stays above $100, the bulls are likely to break out of the range once again. If successful, the next target on the upside is $167.608.
Conversely, if the cryptocurrency fails to break out of the range, it might slide to its bottom. The supports on the downside are at $80.352 and $65.031.
DASH/USD
Dash has made huge inroads into the Venezuelan economy. About 2,500 merchants in Venezuela accept Dash payments, which is more than half of the total 4,500 merchants around the globe that accept it.
Recently, Church’s Chicken restaurants started accepting Dash payments in Venezuela. With its popularity picking up, it is no surprise that Dash’s partner Kriptomobile has managed to sell 53,000 KRIP phones in Venezuela so far.

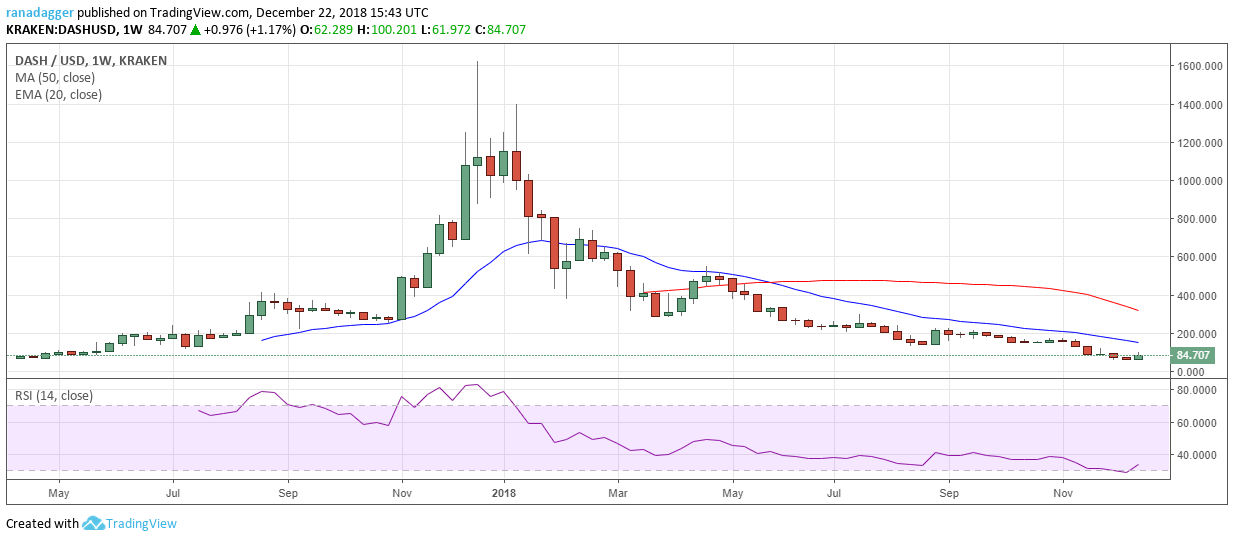
The trend in the DASH/USD pair is clearly down. It has been on a one-way move since topping out at $1,625 in December 2017. This week, the price had bounced to triple digits from a low of $56.214 last week. Though the rebound is impressive, it cannot be considered a trend change.
In order for the trend to change, the price will have to stabilize, form a basing pattern and then signal a trend reversal. If the buying continues, the pullback can reach $120, followed by a move to $160.805, the level from where the current leg of the downtrend started.
On the downside, the support is at $80 and below that at $60. The downtrend will resume if the bears sink the virtual currency below $56.214. Though the short-term traders can ride this move higher, the investors should wait for a new buy setup to form on the weekly chart before establishing new long positions.
Take a look at the best antivirus, anti-malware, anti-spy, etc. software


